
Exploring the features of Palmer penguins using pandas and seaborn
Introduction:
Data visualization plays a crucial role in understanding and communicating insights from data. Seaborn, a powerful Python library built on top of Matplotlib, offers an intuitive interface and a wide range of statistical visualizations. In this tutorial, we will explore the basics of Seaborn and learn how to create stunning visualizations to analyze and present your data effectively.
In this blog post, we will dive into the world of Palmer Penguins and gain insights into their unique features using two powerful Python libraries: pandas and seaborn. We will explore a dataset containing various measurements of different penguin species to uncover patterns, understand relationships, and visualize their characteristics.
Follow this link for a copy of the notebook with outputs
Importing Libraries and Loading the Dataset:
To begin our analysis, we need to import the necessary libraries - pandas and seaborn. Additionally, we will load the “palmerpenguins” dataset which contains measurements of penguins’ body dimensions and other helpful information.
import seaborn as sns
import pandas as pd
import matplotlib.pyplot as plt

# Load the dataset
penguins_df = sns.load_dataset('penguins')
Understanding the Dataset:
To gain an initial understanding of the dataset, let’s examine its structure and the variables it contains. We can achieve this by calling penguins_df.head() and penguins_df.info().
# Display the first few rows of the dataset
print(penguins_df.head())

# Display summary information about the dataset
print(penguins_df.info())
Exploring the Features:
The dataset contains the following columns:
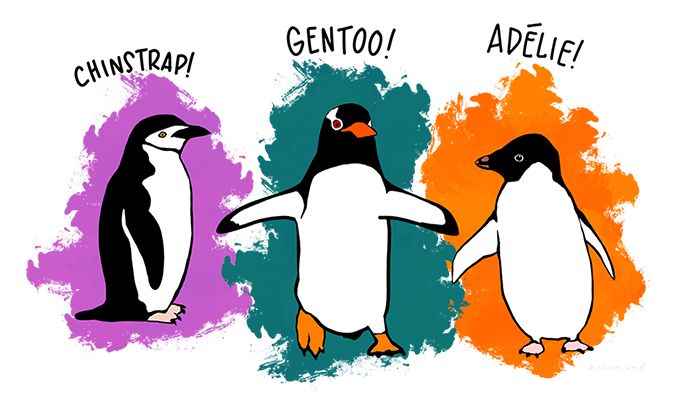
- species: The species of penguin (Adelie, Chinstrap, or Gentoo)
- island: The island where the penguin was observed (Biscoe, Dream, or Torgersen)
- bill_length_mm: The length of the penguin’s bill in millimeters
- bill_depth_mm: The depth of the penguin’s bill in millimeters
- flipper_length_mm: The length of the penguin’s flipper in millimeters
- body_mass_g: The body mass of the penguin in grams
- sex: The sex of the penguin (male, female)
Summary Statistics:
To gain insights into the different penguin species, we can calculate some summary statistics. For example, we can use pandas’ groupby() function to calculate the average body mass for each species:
# Calculate average body mass by species
avg_body_mass = penguins_df.groupby('species')['body_mass_g'].mean()
print(avg_body_mass)
Visualizing the Data:
Visualizations help us understand the relationships between variables and reveal patterns. Using seaborn, we can create informative visualizations quickly and easily.
Scatter Plot:
We can start by creating a scatter plot to examine the relationship between culmen length and culmen depth for each species of penguin.
sns.scatterplot(data=penguins_df,
                x='culmen_length_mm',
                y='culmen_depth_mm',
                hue='species')
Box Plot:
A box plot allows us to visualize the distribution of numeric variables across different categories. Let’s create a box plot to compare the flipper lengths of each penguin species.
sns.boxplot(data=penguins_df,
            x='species',
            y='flipper_length_mm')
Pair Plot:
A pair plot enables us to visualize the pairwise relationships between multiple variables. Let’s create a pair plot for all numeric columns, colored by species.
sns.pairplot(data=penguins_df, hue='species')
Conclusion:
In this blog post, we explored the unique features of Palmer Penguins using pandas and seaborn. We loaded the dataset, analyzed its structure, calculated summary statistics, and created visualizations to gain insights into penguin characteristics.
By leveraging the power of these Python libraries, we were able to visualize relationships, identify patterns, and compare different penguin species. This analysis can provide valuable knowledge about these remarkable creatures and serve as a foundation for further exploration.
Remember, with pandas and seaborn, the possibilities for data exploration and visualization are endless. In the next series of pandas/seaborn tutorials we will delve a litte rdeeper in to the more intermediate capabibilities.
Leave a comment